
Whether you’re building dashboards, analytics tools, or reporting systems, mastering dynamic chart creation enhances your ability to showcase data effectively online.
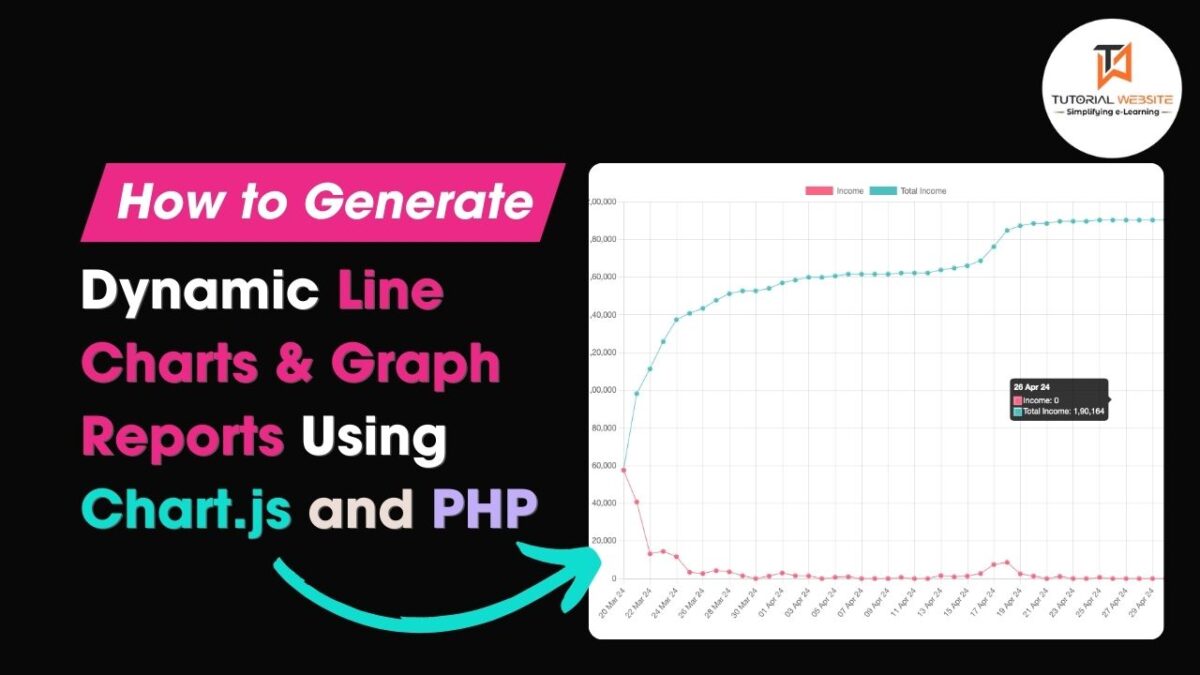
Line charts are powerful visualization tools used to display trends and changes over time. In web development, Chart.js is a popular JavaScript library for creating dynamic and interactive charts. Combining Chart.js with PHP allows you to fetch data from a server-side source and dynamically generate line charts based on that data. In this article, we’ll explore how to create dynamic line charts using Chart.js and PHP, step by step.
Suggested Read: How to Convert HTML to PDF in CodeIgniter using Dompdf Library
To create a dynamic line chart with Chart.js and PHP, you’ll need to perform the following steps:
- Fetch data from database using PHP.
- Format the data appropriately for Chart.js.
- Render the line chart using Chart.js.
Step 1: Fetch data from database using PHP
You need to create a PHP script that retrieves the data from database which you want to visualize. This could involve querying a database or fetching data from another source.
Create a page data.php and fetch data from database and store like below format.
Step 2: Format Data for Chart.js
Once you have the data in your JavaScript code, you need to format it for Chart.js. You’ll typically create arrays for labels and datasets.
Create a page index.php and copy and paste the below code.
Dynamic Line Chart | Tutorialswebsite
Are you want to get implementation help, or modify or extend the functionality?
A Tutorialswebsite Expert can do it for you.
Step 3: Render the Line Chart with Chart.js
In this example, we use the fetch API to retrieve data from databasr using PHP backend. We then extract the labels and data values from the response and use them to create a line chart using Chart.js. Make sure to adjust the data retrieval logic to match your backend setup and data format.
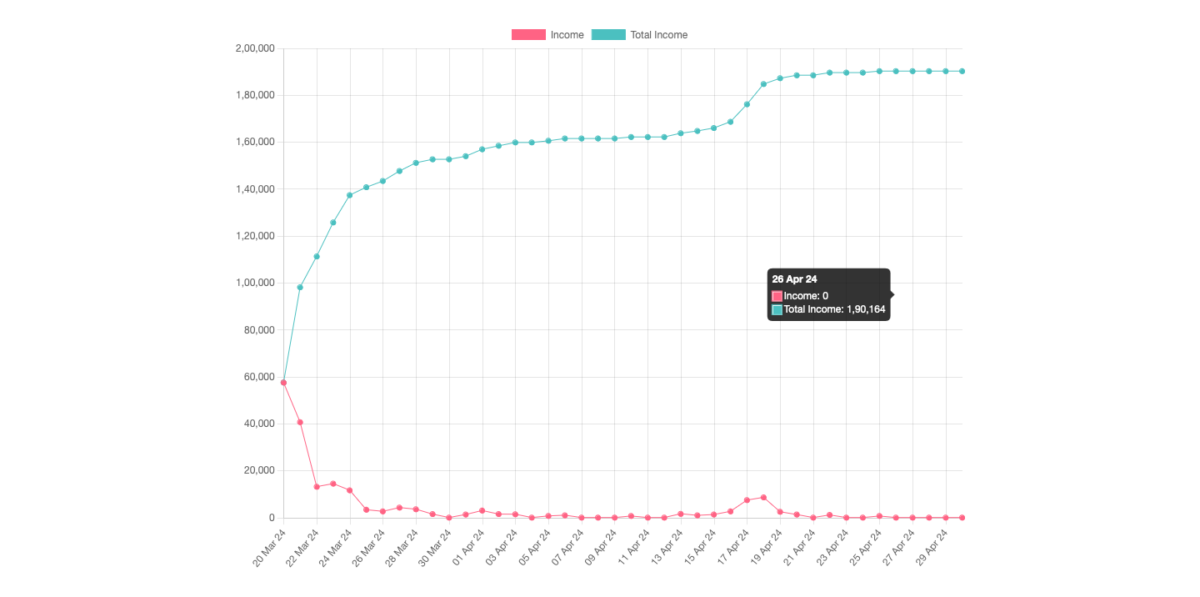
This example assumes that your PHP script returns data in the format [[“Day”,”Income”,”Total Income”], [“20 Mar 24”,57506,57506], ...].
That’s it! With these steps, you should be able to create a dynamic line chart using Chart.js and PHP.
Output
Related Post: Creating Interactive GeoCharts with PHP and Google Charts API
Conclusion
Creating dynamic line charts with Chart.js and PHP offers a flexible and efficient way to visualize data-driven insights on the web. By leveraging the power of server-side scripting with PHP and the rich visualization capabilities of Chart.js, developers can create compelling charts that dynamically respond to changes in data.
Thanks for reading 🙏, I hope you found the How to Generate Dynamic Line Charts in PHP Using Chart.js tutorial helpful for your project. Keep learning! If you face any problems – I am here to solve your problems.

Pradeep Maurya is the Professional Web Developer & Designer and the Founder of “Tutorials website”. He lives in Delhi and loves to be a self-dependent person. As an owner, he is trying his best to improve this platform day by day. His passion, dedication and quick decision making ability to stand apart from others. He’s an avid blogger and writes on the publications like Dzone, e27.co


[…] Suggested Read: Generating Dynamic Line Charts & Graph Reports Using Chart.js and PHP […]